Scripting Guys Blog Posts on Using Visual Studio Code for PowerShell Development

If  you’re looking for a bit more up-to-date getting started guide on using PowerShell with Visual Studio Code, check out these blog posts:

Get started with PowerShell development in Visual Studio Code

Visual Studio Code editing features for PowerShell development – Part 1

Visual Studio Code editing features for PowerShell development – Part 2

Debugging PowerShell script in Visual Studio Code – Part 1

Debugging PowerShell script in Visual Studio Code – Part 2

Posted in PowerShell, VSCode | 4 Comments

Preview of Module Build and Publish with Visual Studio Code and the PowerShell Extension

We are noodling around with how to best provide support for publishing modules to the PowerShell Gallery from a PowerShell workspace within Visual Studio Code.  In today’s release of the PowerShell extension for VSCode (version 0.5.0), we have included an example of how this might work in a future release which I’ll discuss at length in this blog post.

If you haven’t already got Visual Studio Code and the PowerShell extension, see my blog post on Getting Started with Visual Studio Code.  If you already have Visual Studio Code and the PowerShell extension, make sure you have updated both to their latest versions – currently 0.10.10 for VS Code and 0.5.0 for the PowerShell extension.

The “examples” directory that comes with the PowerShell extension has been updated to add a sample module implementation consisting of the following files:

image

The module files consist primarily of SampleModule.psd1, SampleModule.psm1, ReleaseNotes.md and the about topic file en-US\about_SampleModule.help.txt.

There are two files that do the work of building a Release directory and copying over the module files and directories to be published, then running Pester tests and finally publishing the module.  Note: the publish step in the examples directory runs Publish-Module with –WhatIf so no publishing actually takes place.

The Build.ps1 file is a PSake script that contains the tasks: Init, Clean, Build, Test, PrePublish, Publish and PostPublish.  There are also a few utility tasks: ShowKey and StoreKey. I’ll cover keys later. The tasks have been written in a generic way so that you typically only need to customize a few properties e.g.:

Properties {
    # The name of your module should match the basename of the PSD1 file.
    $ModuleName = (Get-Item $PSScriptRoot\*.psd1)[0].BaseName

    # Path to the release notes file.  Set to $null if the release notes
    # reside in the manifest file.
    $ReleaseNotesPath = "$PSScriptRoot\ReleaseNotes.md"

    # The directory used to publish the module from.  If you are using Git, the
    # $PublishDir should be ignored if it is under the workspace directory.
    $PublishDir = "$PSScriptRoot\Release\$ModuleName"

    # The following items will not be copied to the $PublishDir.
    # Add items that should not be published with the module.
    $Exclude = @(
        'Release',
        'Tests',
        '.git*',
        '.vscode',
        # The next three files are unique to this examples dir.
        'DebugTest.ps1',
        'Stop*.ps1',
        'Readme.md',
        (Split-Path $PSCommandPath -Leaf)
    )

    # Name of the repository you wish to publish to. Default repo is the PSGallery.
    $PublishRepository = $null

    # Your NuGet API key for the PSGallery.  Leave it as $null and the first time
    # you publish you will be prompted to enter your API key.  The build will
    # store the key encrypted in a file, so that on subsequent publishes you
    # will no longer be prompted for the API key.
    $NuGetApiKey = $null
    $EncryptedApiKeyPath = "$env:LOCALAPPDATA\vscode-powershell\NuGetApiKey.clixml"
}

You can get by with leaving most of these properties at their default values.  There are also two empty tasks – PrePublish and PostPublish – in which you can place PowerShell script to, for example, sign your module files before publishing or copy artifacts to other locations after publishing.

The second file that makes this work is the .vscode\tasks.json file which contains definitions for the Clean, Build, Publish and Test tasks.  Here’s a sample of that file e.g.:

{
    "taskName": "Build",
    "suppressTaskName": true,
    "isBuildCommand": true,
    "showOutput": "always",
    "args": [
        "Write-Host 'Invoking PSake...'; Invoke-PSake build.ps1 -taskList Build;",
        "Invoke-Command { Write-Host 'Completed Build task in task runner.' }"
    ]
},
{
    "taskName": "Publish",
    "suppressTaskName": true,
    "showOutput": "always",
    "args": [
        "Write-Host 'Invoking PSake...'; Invoke-PSake build.ps1 -taskList Publish;",
        "Invoke-Command { Write-Host 'Completed Publish task in task runner.' }"
    ]
},

Notice the “isBuildCommand” setting for the Build task above is set to true.  This task is declaring to VSCode that it is the “Build” command for this VSCode workspace which means you can press Ctrl+Shift+B to “build” the Release directory.

NOTE: Building and publishing require the installation of PSake.  The good folks working on PSake should be publishing it to the PowerShell Gallery soon thanks to PowerShell MVP Dave Wyatt’s help in setting up the module for publishing.  You should be able to install the module with the command:

PS C:\> Install-Module PSake -Scope CurrentUser

If the module can’t be found, download it from here and install it manually.

There is also a task for running Pester tests.  Its “isTestCommand” setting is set to true so you can press Ctrl+Shift+T to run your Pester tests at any time.

So let’s look at a run through of opening the Examples folder and running the Build task in this animated gif.

VSCodeTaskBuild

The build task created the “Release” folder and copied just the files we want in our module to that folder. That’s the folder we will tell the Publish-Module command to use.  This is more reliable than trying to publish with a module name and relying on Publish-Module to find the one you intended by searching the $env:PSModulePath.  You can customize which files or directories are excluded from the Release directory by modifying the $Exclude hashtable property in the Build.ps1 file.

Every time you run the Build task, the first step is to execute the Clean task which “cleans” out the Release\SampleModule directory so you have just the files in there you expect.  This also means you should not author any new files in this directory since the contents will be deleted on the next Build (or Publish).

If you are using Git, the examples folder comes with a .gitignore that is configured to not check-in the Release directory as well as a temporary file that gets created in the Test directory.

Now lets see how the publish process works.  As I mentioned above, you can play with this all you want since the Publish-Module command is specified with the “-WhatIf” parameter.  However, to demonstrate how this “would” work we do prompt for a NuGet API Key. For this example, you can type in any garbage string you want.  What you will note though, is that the second time you run the Publish task, you will NOT be prompted for that key.  That is because the Build.ps1 script will encrypt your NuGet API key and store it in your user profile directory – at this location: $env:LOCALAPPDATA\vscode-powershell\NuGetApiKey.clixml.

Let’s run the publish task and see what this looks like:

VSCodeTaskPublish

Notice that after the Build step, all of your Pester tests are executed just to make sure that everything is working correctly before the publish step is attempted.  One of the Pester tests will likely be a canned test – it submits your PSD1 manifest file to the Test-ModuleManifest command.

Hopefully this looks pretty cool to you.  I encourage you to look at the Build.ps1 script and if you spot any issues or have any feedback in general, let us know on GitHub.

There is a lot left to figure out.  Right now, we’ve crafted the tasks.json file, put in place the Build.ps1 file, the .gitignore file, provisioned a PSD1 module manifest file, started an about topic, etc.  What we would like to do is provide a mechanism by which you can tell the PowerShell extension to generate a “New PowerShell Gallery Module Project” or “New PowerShell Module Project” or “New Module Manifest File”.  This scaffolding capability will be a major addition to the PowerShell extension IMO.  But we also want to make sure that we don’t make too much of the build & publish process “black-box” i.e. built-into the extension where it can’t easily be modified.  We are hoping that by using the VSCode task runner and PSake for build scripts, we keep the part you are mostly likely going to want to customize open to such customization.

Posted in PowerShell, PowerShellEditorServices, VSCode | 6 Comments

Breakpoint Enhancements in the v0.5.0 PowerShell Extension for Visual Studio Code

Visual Studio Code 0.10.10 released today with many new features including indentation-based code folding and UI support for configuring “function” breakpoints.  In this blog post, I’ll show you a few new features what we have planned for the 0.5.0 release of the PowerShell extension for Visual Studio Code, which should be available towards the end of March.  The two features I’ll show in this blog post are support for conditional breakpoints and function breakpoints in the VSCode debugger.

Conditional Line Breakpoints

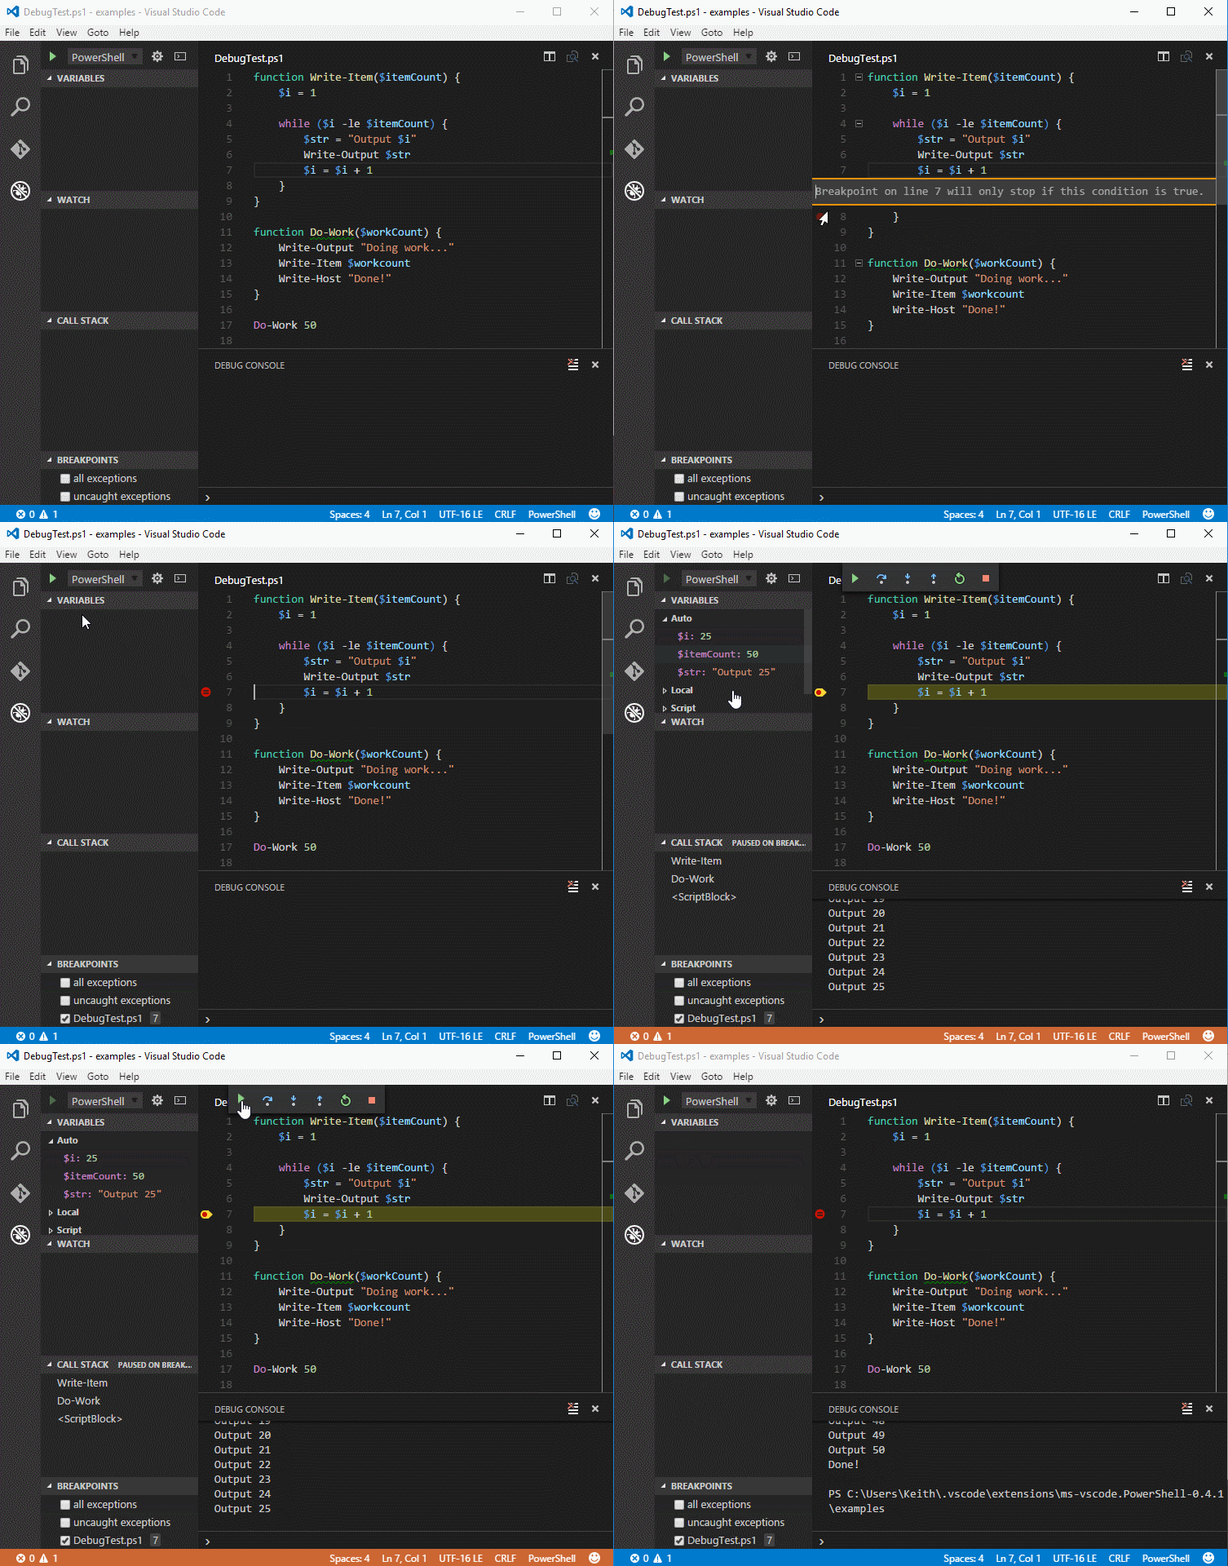
Conditional line breakpoints will break on a line of script only when the user supplied condition evaluates to true.  The following animated gif shows how to add a conditional breakpoints.

VSCodeCondBreakpoint2

You can also add a condition to an existing line breakpoint by right-clicking on the breakpoint and selecting “Edit Breakpoint” e.g.:

VSCodeEditBreakpoint

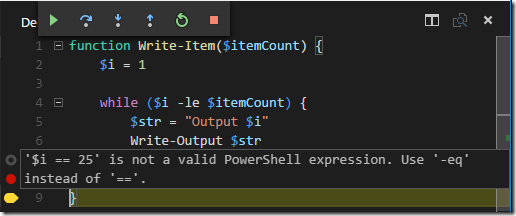
Note that if you supply an invalid expression, it is currently a bit tricky to find out that the expression is invalid.  If you find that your conditional breakpoint is not firing, I suggest you put a normal breakpoint before or after the conditional breakpoint and run your code.  This should allow you to see what is wrong with the conditional breakpoint.  Note the “dimmed” out breakpoint glyph below on line 7 and the tooltip describing what’s wrong with the condition e.g.:

VSCodeBadCondMessage3

With conditional breakpoint expressions, be sure to use “PowerShell” operators like -eq, -ne, -gt, -ge, -lt and -le.

That’s pretty neat but … we can do more. 

Conditional breakpoints use the PowerShell breakpoint mechanism which allows you to run a user-supplied scriptblock when a breakpoint is encountered.  This is what the Action parameter is for on the Set-PSBreakpoint command.  The PowerShell extension uses this functionality behind the scenes to support VSCode conditional breakpoints.  And the good news is that you have access to the Set-PSBreakpoint Action functionality as well.

When you type a basic expression such as “$i –eq 25”, that is converted to “if ($i –eq 25) { break }” and supplied to the Action parameter when the breakpoint is set.  Most folks can provide a simple boolean expression as the condition upon which to break.  However, advanced users can provide a expression that contains either a “continue” or a “break” statement and the expression will be passed “as-is” to the Action parameter.  This allows you to create “tracepoints”.  That is, a breakpoint that when triggered, will execute its “action” scriptblock and then automatically resume execution of the script – as if it had never stopped. 

Tracepoints are handy when you want to sprinkle in a little “printf-style” debugging to output state information to the console without breaking into the debugger.  And without having to modify the script.  Maybe the script is signed and you don’t want to bother with resigning it (or stripping out the signature).  Here’s an example that creates a tracepoint to output information about the state of the script as it runs.

VSCodeCondBreakpoint3

Note that the script never appears to stop at the tracepoint.  The script in fact, runs to completion after the Start button is pressed. Yet the tracepoint information has been written out to the Debug Console.

Function Breakpoints

Even though Visual Studio Code refers to this feature as “function breakpoints”, PowerShellers know this feature as “command breakpoints”.  That is, you can set a breakpoint not just on a function in PowerShell but also on an alias, built-in command or application. 

The use of function breakpoints is very straightforward as the next animated gif demonstrates:

VSCodeFuncBreakpoint

Note that when the debugger stops on a “function breakpoint” there is no breakpoint glyph in the left gutter of the editor window like you would see for a line breakpoint.  However, you can look in the call stack viewlet and it will indicate if the debugger is stopped on a function breakpoint with “PAUSED ON FUNCTION BREAKOINT”.

There you have it.  A few minor debugging enhancements that can come in very handy.  Remember, these features are in the v0.5.0 version of the PowerShell extension due out towards the end of March.

Posted in PowerShell, PowerShellEditorServices, VSCode | Leave a comment

Creating a PowerShell Command that Process Paths using Visual Studio Code

Writing functions that need to process paths in PowerShell and do everything that PowerShell users expect can be tricky.  Here are some of the features that folks expect for a fictitious function called “Edit-File” (well, there *is* an Edit-File command in PSCX) :

PS C:\> Edit-File –Path C:\foo.txt, C:\bar.txt # do you handle an array of paths
PS C:\> Edit-File –Path C:\*.txt # do you support wildcards
PS C:\> Edit-File –Path ..\foo.txt # do you support relative paths
PS C:\> Edit-File –Path ~\foo.txt # do you resolve paths with ~ in them
PS C:\> Edit-File –LiteralPath C:\foo[1].txt # do you support literal paths
PS C:\> Get-ChildItem . -Recurse *.txt | Edit-File # do you support piping from Get-ChildItem

In addition to these, do you test if the path exists and give a good error message?  Do you support “ShouldProcess”?  Is the Path parameter set as the default parameter set?

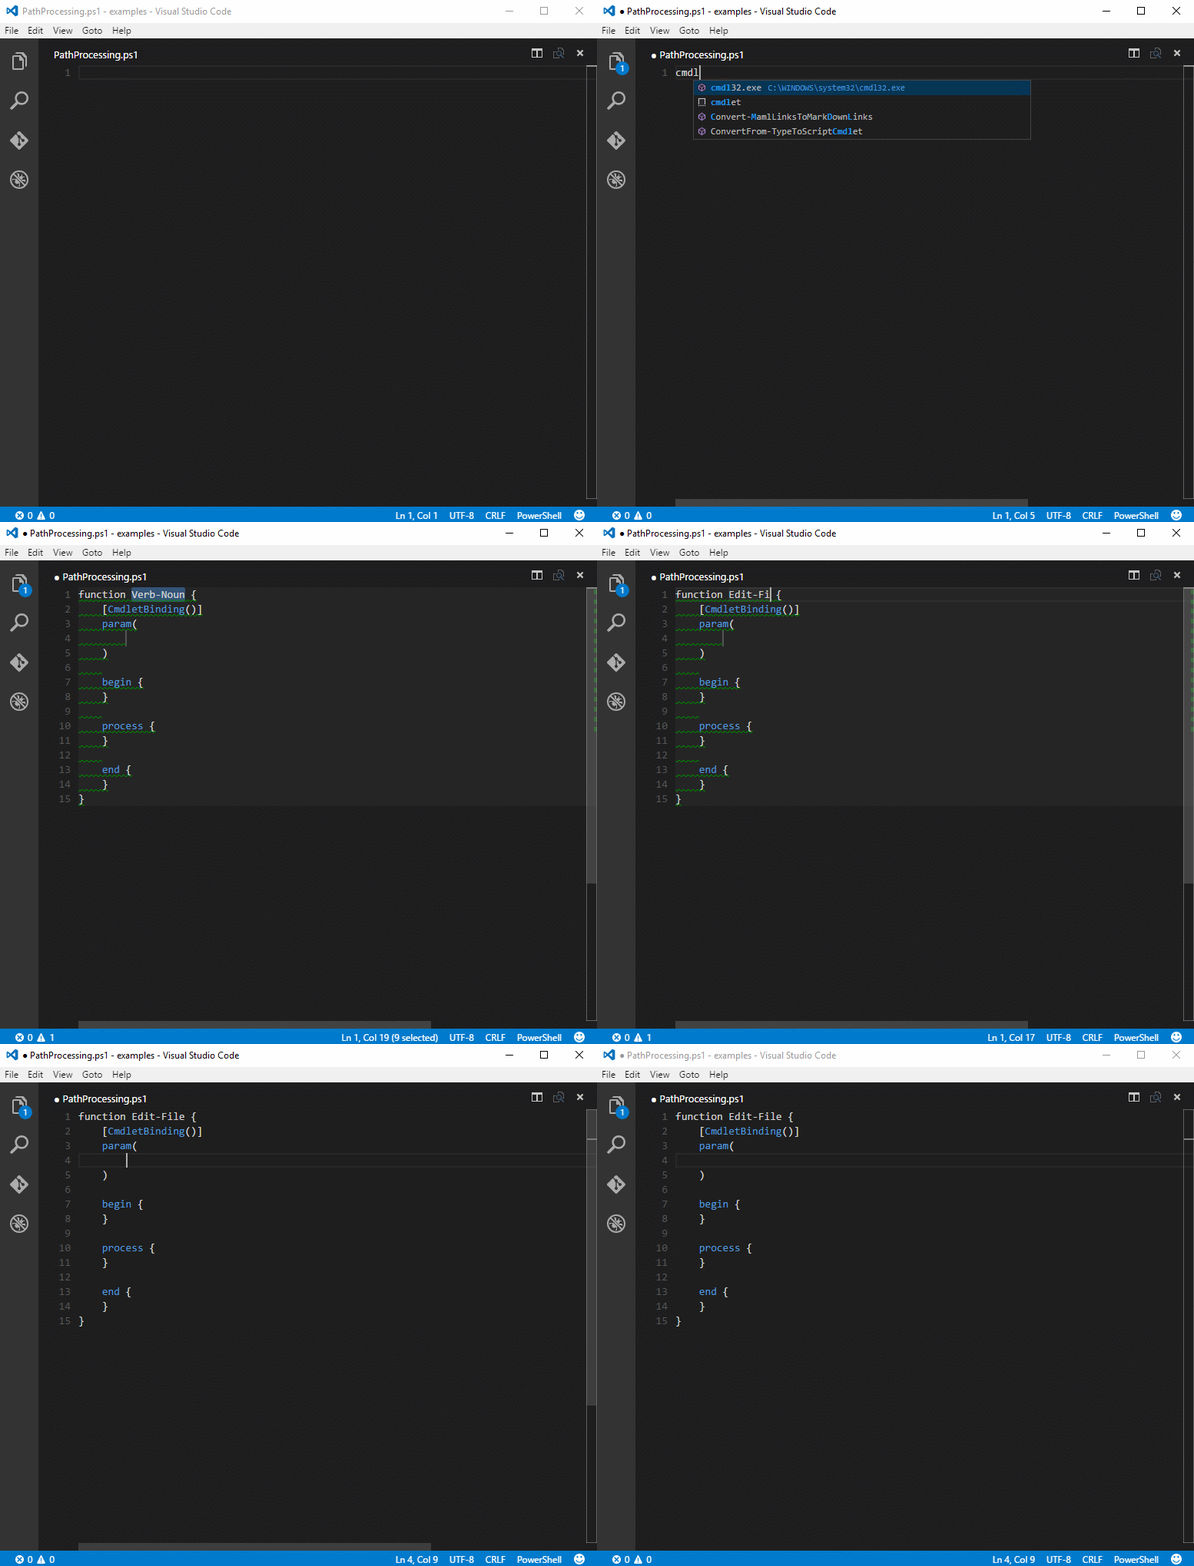
In order to make the creation of path processing functions easier, we have created some productivity and example code snippets in the PowerShell extension for Visual Studio Code.  Let’s get started by scaffolding out an empty cmdlet style function using the “cmdlet” productivity snippet e.g.:

Path1

Now that we have an empty cmdlet function (aka advanced function) scaffolded, lets add two parameters – Path and LiteralPath:

Path2

No we have both a Path and a LiteralPath parameter.  They are defined in different parameter sets: Path and LiteralPath.  You can change those parameter set names as appropriate for your function.

The Path parameter validates input, declares support for wildcards and sets its type to “[string[]]”.  This means the user can specify more than one path when using the Path parameter.  Also note that pipeline input support has been set up and the parameter is declared as a positional (position 0) parameter.  Change or remove the positional property as necessary for your function.

The LiteralPath parameter also validates input and declares an alias of “PSPath”.  This is crucial, along with setting ValueFromPipelineByPropertyName to true, to enable this function to be able to handle pipeline input from commands like Get-ChildItem.  This parameter is also set to position 0.  Again, change or remove this property as necessary for your function.

We have the two parameters configured.  It’s not rocket science but not as simple as one might hope.  Now we need to drop in some script to process the values applied to these two parameters.  What follows is use of an “example” snippet – “ex-path processing for wildcards allowed” – from the PowerShell extension for VS Code.  This is one particular way of implementing the script to process both of these parameters, which is why this snippet is in the example category:

Path3

Wow!  That’s a good bit of script but it is necessary for both robust handling of paths that might be relative, contain wildcards (for the Path parameter) or special characters like “~” and for providing good errors when the path doesn’t exist.  BTW there may be times when “by definition” the path doesn’t exist e.g. you’re writing a New-ProjectFile function.  For that scenario, see the snippet “ex-path processing for non-existing paths”.

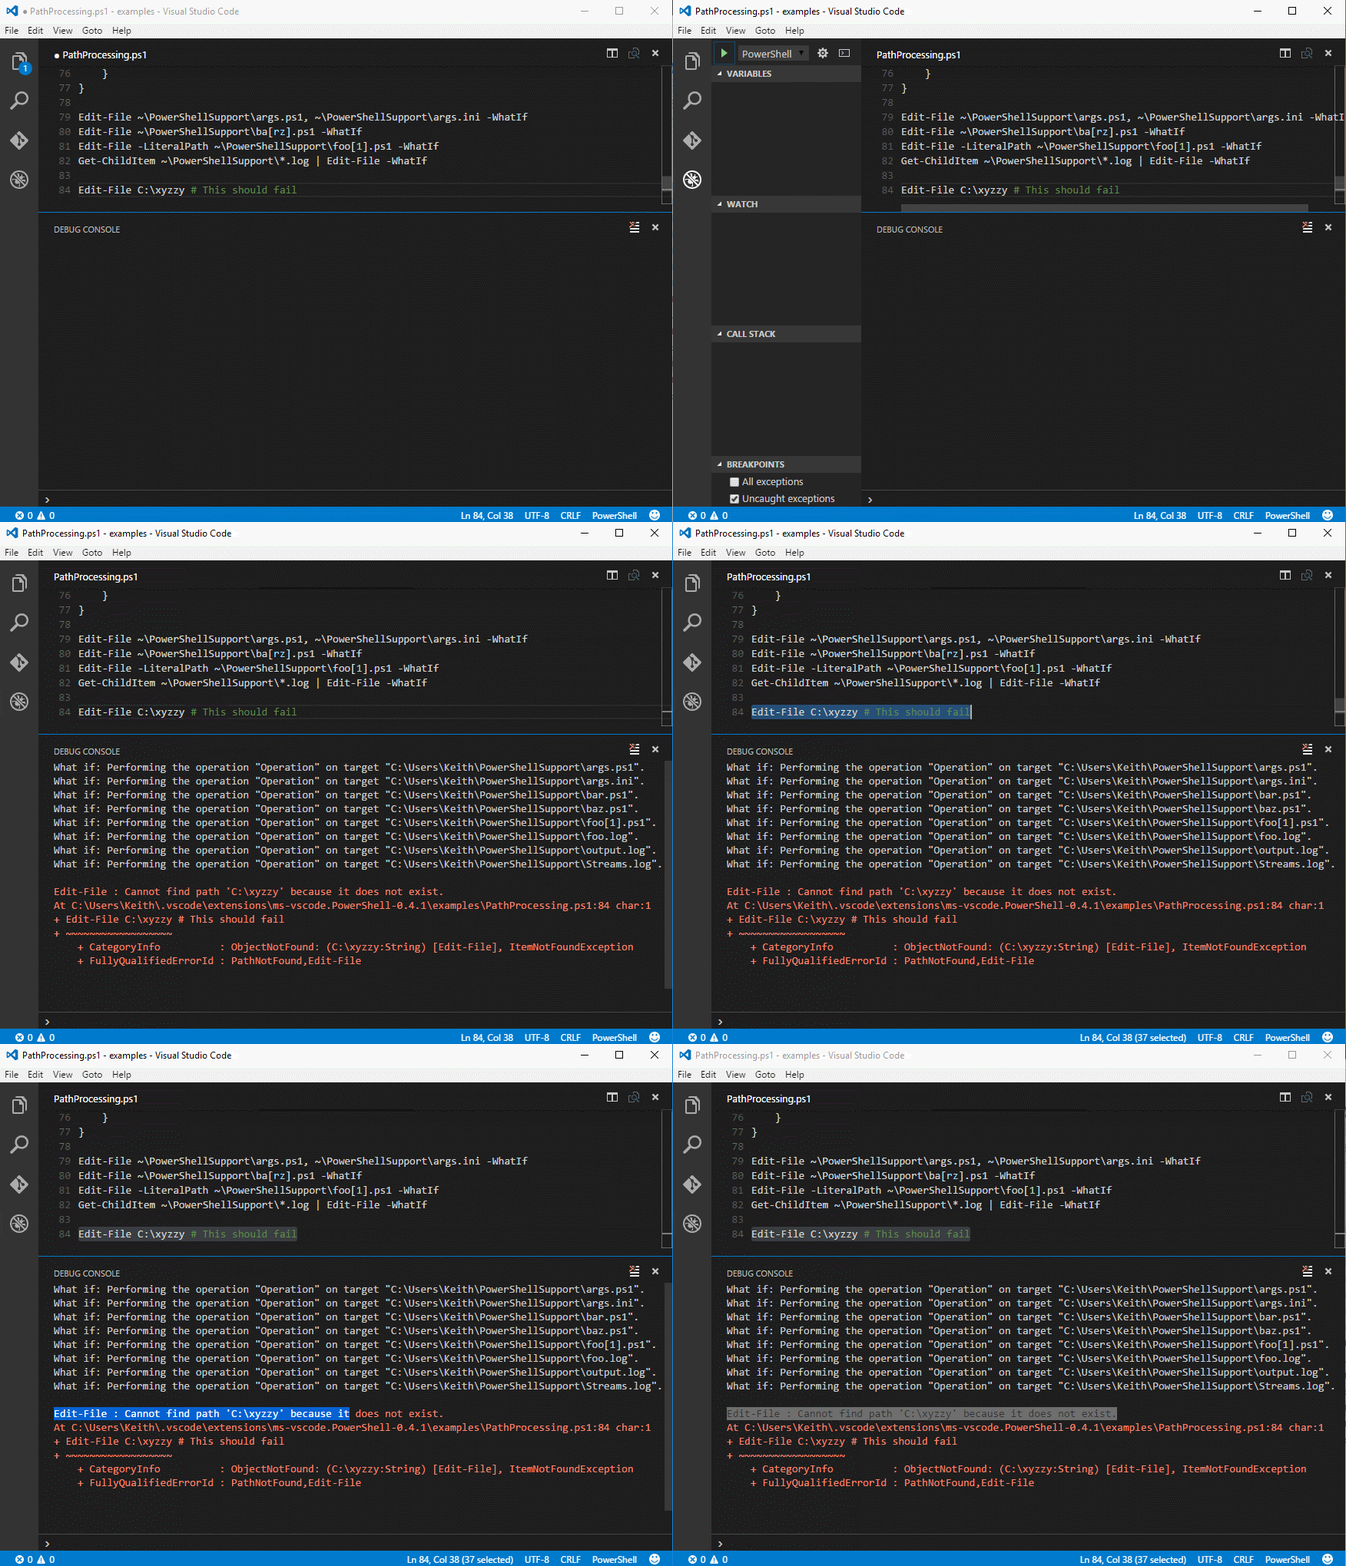
OK let’s test the script above and see how it works:

Path4

When you open the PowerShell extension’s Examples folder “~\.vscode\extensions\ms-vscode.PowerShell-0.4.1\Examples” you will see the following files:

* PathProcessing.Tests.ps1
* PathProcessingNonExistingPaths.ps1
* PathProcessingNoWildcards.ps1
* PathProcessingWildcards.ps1

The first file is a Pester test to ensure the snippets used to create the other three files, processes paths correctly.  If you have this folder open, press Ctrl+Shift+T to run the Pester tests in the first file.  You should see these results:

Path5

Please take these snippets for a spin.  If you find any issues or have suggestions, please submit them to the extension’s GitHub project.

Posted in PowerShell, PowerShellEditorServices, VSCode | Leave a comment

New Release of PowerShell Extension For Visual Studio Code

There’s a new version (0.4.0) of the PowerShell extension for Visual Studio Code out with some really nice enhancements.  There’s also a new version of Visual Studio Code (0.10.8) out with lots of improvements as well (read about those here).  I encourage you to pick up both!  If you don’t already have VSCode or the PowerShell Extension, see my blog post on Getting Started with Visual Studio Code for Use with PowerShell.  If you already have these, be sure to check for updates on both.

The enhancements to the PowerShell extension fall into two different categories: editing enhancements and debugging enhancements.  There are also some new features and bug fixes in the new version of Visual Studio Code that enable a number of the new features discussed below.  So make sure you update to the new version of Visual Studio Code!

Editing Enhancements

Auto-completion lists have been improved in several ways.  First, paths used to complete like this:

msohtmlclipclip_image001[1]

The full path was displayed in the drop down list and once the path started getting long, the completion list items started to get clipped leaving you wondering what you were going to get when you selected a clipped item.

Now paths auto-complete the same way they do in PowerShell ISE.  Only the current directory’s contents are listed.  BTW I have a enhancement request into the VSCode project to provide a folder icon in addition to the built-in file icon.

msohtmlclipclip_image002[1]

PowerShelll command parameter completion used to get sorted lexicographically by VSCode.  Note the common parameters intermingled command-specific parameters (and lack of parameter type info):

msohtmlclipclip_image003[1]

In the updated PowerShell extension, we get the same sort order as you would see in ISE (plus the type info).  This is preferable because most of the time you’re interested in the command-specific parameters.

msohtmlclipclip_image004[1]

Completion lists for PowerShell commands also get improved by giving more info about the command, such as which command an alias resolves to or the path for an exe e.g.:

msohtmlclipclip_image005[1]

We also spent a good bit of time on improving the built-in snippets.  The snippets by default are productivity oriented and not teaching/example snippets e.g.

msohtmlclipclip_image006[1]

We still have the teaching/example snippets but they all start with “ex-“ e.g.:

msohtmlclipclip_image007[1]

PowerShell MVP Doug Finke added several new editor commands: Open file in ISE and find module.

Debugging Enhancements

Fellow PowerShell MVP Adam Driscoll added support for a 32-bit (x86) debug host.  The default debug host runs as a 64-bit process on 64-bit Windows and as a 32-bit process on 32-bit Windows.  The PoweShell x86 debug host always runs as 32-bit on 64-bit Windows.

In 0.3.1, when you opened a folder where you hadn’t debugged before you would press the little “gear” icon in the VSCode debug window, you would select the “PowerShell” debugger.  Now you will have two options to select from: “PowerShell” and “PowerShell x86″.  Once you select the debug host, VSCode will generate a .vscode directory in your workspace folder and then generate a launch.json file into that folder.  The file used to contained this:

{
    "version": "0.2.0",
    "configurations": [
        {
            "name": "PowerShell",
            "type": "PowerShell",
            "request": "launch",
            "program": "SET_SCRIPT_FILE_PATH_HERE.ps1"
        }
    ]
}

In 0.4.0 it will look like this:

{
    "version": "0.2.0",
    "configurations": [
        {
            "name": "PowerShell",
            "type": "PowerShell",
            "request": "launch",
            "program": "${file}"
            "args": [],
            "cwd": "${file}"
        }
    ]
}

There several new features to point out in the updated launch.json file.  Note: if you have an existing launch.json file, you can add the new parameters and values.  And if you want to use the 32-bit debug host, change the “name” and “type” params to “PowerShell x86’’.  If you would like to switch between both 32-bit and 64-bit debug hosts, modify your launch.json to the following, which will allow you to select either “PowerShell” or “PowerShell x86” from the VSCode Debug view toolbar:

{
    "version": "0.2.0",
    "configurations": [
        {
            "name": "PowerShell",
            "type": "PowerShell",
            "request": "launch",
            "program": "${file}"
            "args": [],
            "cwd": "${file}"
        },
        {
            "name": "PowerShell x86",
            "type": "PowerShell x86",
            "request": "launch",
            "program": "${file}"
            "args": [],
            "cwd": "${file}"
        }
    ]
}

You no longer have to specify the file to launch in the debugger via the “program” param.  By default the value of “${file}” will cause the file in the active editor window to be launched by the debugger.  This value has to be an absolute path.  This behavior is like PowerShell ISE’s behavior and is much more convenient.  However if you have say a readme.md active, it will try to debug that with PowerShell and fail.  If you want to specify a script to always start for a workspace no matter which editor window is active,  you can specify an absolute path to the “program” param.  You can use the ${workspaceRoot} variable to refer to your workspace root directory.

You can now pass arguments to your script by modifying the “args” parameter.  You can specify a single string like so:

"args": [ "-Path C:\\Users\\Keith *.ps1 -Recurse" ]

You can also break up the parameters into different strings if you prefer. In the debug host, they will be concatenated using a space delimiter into a single string:

"args": [ "-Path", "C:\\Users\\Keith", "*.ps1", "-Recurse" ]

In the previous version of the extension the debugger would start using the install directory of Visual Studio Code as the working dir.  Not very helpful.  In the new version, the launch.json file is configured to configure the current working directory “cwd” in the debug host as the parent directory of the file that is in the active editor pane.  This is usually the parent folder of the script that is launched (assuming the “program” param is still set to “${file}”).   You can modify this to any absolute path you want.  Again to reference the workspace root directory you can use ${workspaceRoot} in your cwd path.

There is a different view for the Debug Console in VSCode 0.10.8 that is wider than taller.  We had problems with PowerShell output (F8 and commands executed from the Debug Console prompt) wrapping at 80 chars.  That wrap limit has been upped that to 120 so the output should look better.   We’ve also fixed output formatting in general so you shouldn’t see much default output with “\r\n” in it.

The VSCode team made the following change which required no work on our part – we got this feature for free!  Check out the highlight on the variables whose values are changing as I step through this code:

msohtmlclipclip_image008[1]

There are some other miscellaneous debugging improvements.  We fixed a bug where you couldn’t set a breakpoint on files with [ ] chars in the path.  We also added support for supplying input to Read-Host via the Debug Console input prompt.  For more information on general debugging improvements in the new version of Visual Studio Code, check out this site.

There you have it.  We are very excited about this release of the PowerShell Extension for Visual Studio Code.  Give it a try and please let us know if you run into any issues.

Posted in PowerShell, PowerShell 5.0, PowerShellEditorServices, VSCode | Leave a comment

Debugging PowerShell Script with Visual Studio Code

In this post we will look at how you can debug your PowerShell scripts using VSCode and the PowerShell Editor Services extension for VSCode.  As a pre-requisite see the post Getting Started with Visual Studio Code for Use with PowerShell on how to install VSCode and the PowerShell extension for VSCode.

One disclaimer about debugging PowerShell script in VSCode before we start.  Even though VSCode is cross-platform, running on Windows, Linux and Mac OS, the debugging support provided by the PowerShell Editor Services extension currently runs only on Windows.  PowerShell MVP Adam Driscoll has been working on enabling debug support on other OS’s by means of remotely connecting to the extension running on a Windows machine from Linux or Mac OS.  I’ll let Adam cover the details of how that works when it releases in a future drop of the PowerShell Editor Services extension.  Now let’s get started debugging PowerShell scripts!

Open VSCode and then use File menu, Open Folder… to open the following folder:

C:\Users\<username>\.vscode\extensions\ms-vscode.PowerShell-<version#>\examples

In the Side Bar on the left, click on the Explore tab and then open the file DebugTest.ps1 e.g.:

image

Put the cursor on line 17 and press F9 to toggle a breakpoint on.  Or you can also click in the left gutter (to the left of the line numbers) to set a breakpoint.

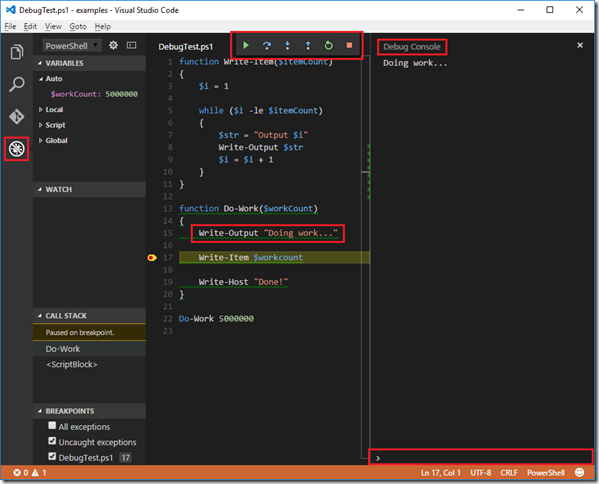
To start debugging, press F5.  Your editor should now show the Debug viewlet in the Side Bar as shown below (sans the red boxes).  Note: you can pull up the Debug view at any time by pressing Ctrl+Shift+D (on Windows). 
image

I want to point out a number of features above.  First, note the “no bug” icon in the left-most area of the Side Bar.  You can click that to bring up the Debug viewlet as well.  When the debugger is running, the debug toolbar at the top center of the VSCode window will be visible.  You can use this toolbar to start/stop debugging and step through your code.  The step buttons use the familiar keyboard shortcuts F10, F11 and Shift+F11.

Notice that the editor, in the image above, is showing that script execution is paused on line 17 where we placed our breakpoint.  In the Call Stack section of the Debug viewlet, you can see that the debugger is one level down in the Call Stack – inside the Do-Work function.  Finally, notice the “Debug Console” window on the right.  This is a REPL that, for now, is only available when you are debugging.  It is displaying script output “Doing work…” from the function Do-Work.  At the bottom of the Debug Console is a prompt from which you can modify variable values and execute PowerShell commands.

Now press the “Stop” button in the debug toolbar or press Shift+F5.  Let’s try debugging another script in this folder.  Type Ctrl+P and then “Stop”, select StopTest.ps1 from the list.  Set a breakpoint on line 2.  Your VSCode editor should look like this:
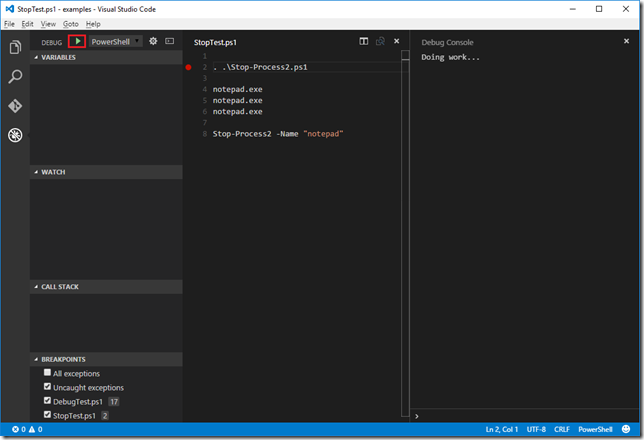
image

Press the green “Start” button or press the F5 key to start debugging.  You will probably be surprised to find that the debugger started up the DebugTest.ps1 script and hit the breakpoint on line 17 in that script.  Why did it do that?

VSCode’s Debug Configuration File – launch.json

The way VSCode knows how to start a debug session, including which file to start debugging, is a JSON settings file called launch.json.  In the PowerShell extension’s Examples directory you will find a folder name “.vscode” with this file in it.  The extension comes “pre-configured” with this launch.json file.  Let’s look at its contents.  Don’t bother trying to navigate to it from VSCode.  You can access it directly by pressing the “Gear” icon in the Debug viewlet’s toolbar e.g.:

image

That will open (or create) the launch.json for the open folder.  You should see this:
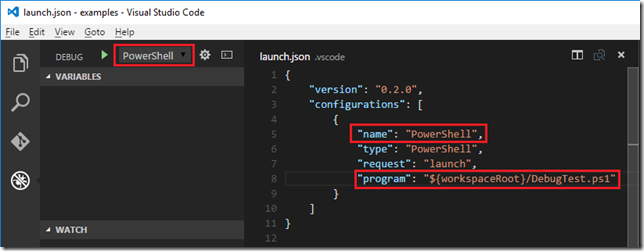
image

Note that the name “PowerShell” in the launch.json file corresponds to the name in the drop down list in the Debug viewlet’s toolbar.  When that name is selected (for now it is the only name available) and you start the debugger, the “program:” setting in launch.json for that configuration determines which script is started by the debugger.  Pretty obvious now why DebugTest.ps1 was started, eh?  Let’s change that.  Modify the launch.json file to the following:

{
    "version": "0.2.0",
    "configurations": [
        {
            "name": "PowerShell",
            "type": "PowerShell",
            "request": "launch",
            "program": "${workspaceRoot}/DebugTest.ps1"
        },
        {
            "name": "StopTest",
            "type": "PowerShell",
            "request": "launch",
            "program": "${workspaceRoot}/StopTest.ps1"
        }
    ]
}

Save the launch.json file.

Now open the drop down list in the Debug viewlet’s toolbar and select StopTest e.g.:
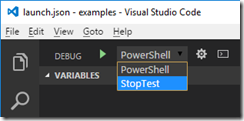
image

Press F5 to start debugging and if your breakpoint in StopTest.ps1 was still set, the debugging will stop at that breakpoint.

Let’s see how this works from one of your own script folders where there is no launch.json file – yet.  Open one of your folders (File | Open Folder…) that contains a script you would like to run under the VSCode debugger.  Open the Debug viewlet (Ctrl+Shift+D) and you will see “<none>” listed in the toolbar:
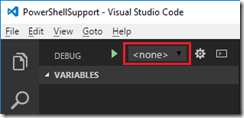
image

It will display <none> when it can’t find a launch.json file in the folder.  We can easily create a new launch.json file by clicking on the gear icon to the right of this drop down list.  From the list “Select Debug Environment”, select “PowerShell”.  VSCode has now created a sub-folder called .vscode with the file launch.json in it.  The file initially contains:
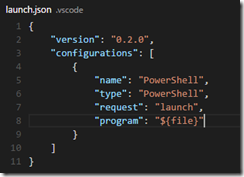
image

In this file, the “program:” setting is set to ${file}”.   In theory, this is what the extension would ship with by default.  If only it worked as expected.  That is, start debugging the currently open, active script file.  But alas, there be bugs here.  Sad smile

Type Ctrl+Shift+P and then type “rel” and press enter.  That will reload the editor.  Now open up one of your scripts and set a breakpoint near the top and press F5 to start debugging.  Note that indeed the debugger started debugging this file.  Cool, just what we wanted.  Now open a different script file and set a breakpoint and press F5.  Doh!  The original file was started (unless the VSCode team has fixed this bug).  This is why I had you reload the window.  The value of ${file} seems to get stuck to the first file that was open and active when you first started debugging.  A bug has been filed against VSCode regarding the behavior of this variable.

Personally, I find it easier to just reload the editor than to have to edit the launch.json file for every different script in a directory that I want to debug.   So I will leave the default of ${file} and hope the VSCode team fixes the bug in a future release.

Let’s wrap up with a few more minor tips.  To toggle the Debug Console open and closed, click the Debug viewlet toolbar button shown below:
image

Regarding the Debug Console, there seems to be a bug where carriage return and line feed gets rendered as text “\r\n” instead of an actual carriage return or line feed.  Hopefully this issue gets resolved in a future update to either VSCode or the PowerShell Editor Services extension.

Watch Window

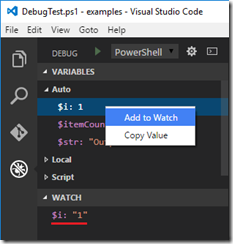
To watch a variable, right click on it in the Variables section of the Debug viewlet as shown below:
image

You can also click on the “+” button in the Watch section’s toolbar (or right-click in the Watch section and select “Add Expression”) e.g.:
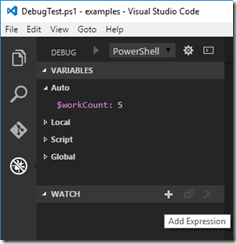
image    image

Typically you would provide a variable name but as “expression” implies, it can be an expression such as “$i + 2″.  You can even put in commands like Get-Date and it will execute them.

That’s a wrap on using VSCode and the PowerShell Editor Services extension to debug PowerShell scripts.  Hopefully you found this post useful and will enjoy using the PowerShell Editor Services powered debugger in VSCode on your PowerShell scripts.  If you find an issue, please submit it on the PowerShell EditorServices GitHub site.

Posted in PowerShell, PowerShellEditorServices, VSCode | Tagged , , | 8 Comments

Getting Started with Visual Studio Code for Use with PowerShell

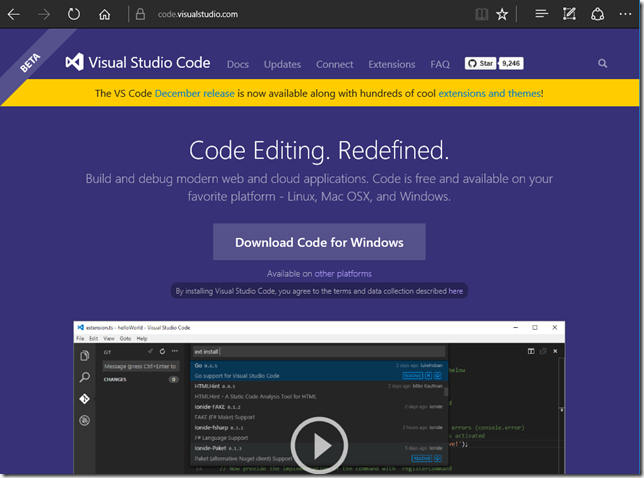
Now that I’ve hopefully piqued your interest in using Visual Studio Code for editing and debugging PowerShell scripts, here is how you get started.  First, go to the Visual Studio code web site to download and install VSCode.  From here you can click on the Download for Windows button to install VSCode on your Windows machine:

image

Note: if you are on Linux or Mac OS, scroll to the bottom of this page to download the respective versions.

Once you have installed VSCode, install the PowerShell Editor Services extension by pressing Ctrl+P, then type “ext install PowerShell” and install the extension named “PowerShell” by clicking on the button to the right of the “README” button:

image

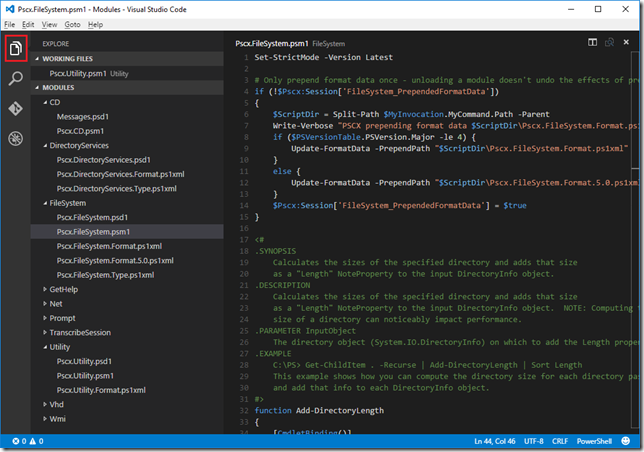
Now try opening a directory that contains some of your PowerShell scripts.  Open the File menu and select “Open Folder …”.  Then select the folder containing your scripts.  Once you do this, all of the scripts will show up in the Explore tab of the Side Bar:

image

As you select different files (or use the cursor keys and enter key) they will show up in the editor window on the right.  If you want to put a file in your “Working Files” list, double-click it (or drag it to the Working Files section).

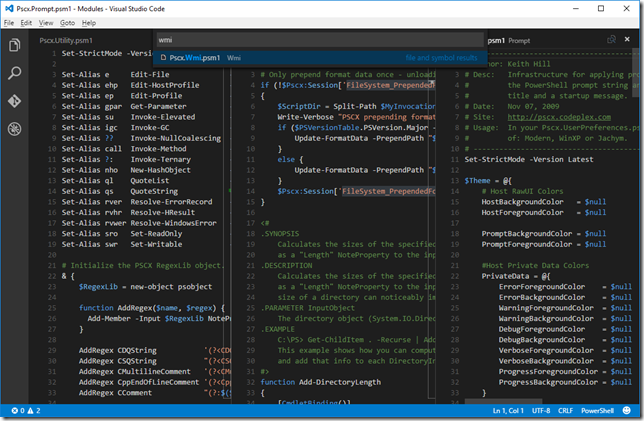
You can have up to three editor panes open at once.  You can open a new editor window by pressing Ctrl+\.  You can switch between the three editor windows using Ctrl+1, Ctrl+2 and Ctrl+3.   Also, when you have this many editor windows open you may want to hide the Side Bar which you can do with Ctrl+B (toggles the Side Bar on and off):

image

Also, you can use various commands from the command palette for things like searching for a file in the folder you have open. Type Ctrl+P and start typing part of the filename to narrow the search down.  Note that VSCode does a fuzzy search so the part of the name you remember can appear anywhere in the filename e.g.:

image

Finally, for this segment, I want to point out the PowerShell editor services configuration settings.  Unless you are developing against the extension itself there isn’t much for you at the moment but you may be interested in one of the settings that turns script analysis on and off.

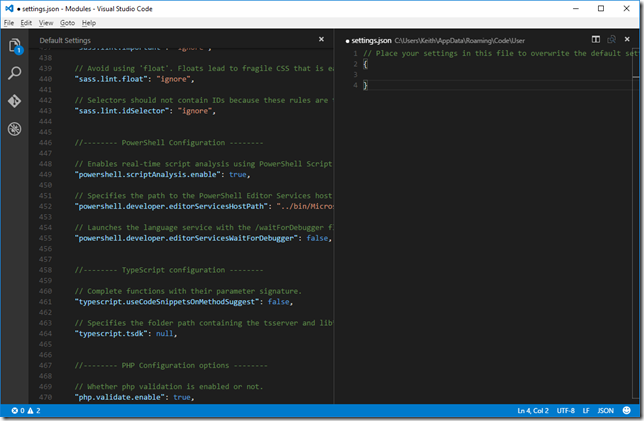
To edit your user settings, press Ctrl+Shift+P, then type “user” and press enter.  Your editor should look like this to start with (unless you’ve already configured user settings) and you will need to scroll down in the left editor window to get to the powershell section:

image

The editor window on the left is the Default Settings for VSCode and all installed extensions.  Note that the default for “powershell.scriptAnalysis.enable” is “true”.  To change this setting, copy the line from the left to your user settings file in the right editor pane between the curly braces.  Try this trick, place the cursor in the word “true” on the line you just copied to your settings.json file and press Ctrl+Shift+<period>.  Notice how the true changes to false?  Pretty slick.

It is likely this will be the only setting for the PowerShell extension you will want to change.  Be sure to save the changes to your settings.json file.

I recommend that you look at the rest of the settings in the Default Settings file to see which other settings you’d like to configure in your settings.json file.  One I like to override is:

//-------- Files configuration --------
"files.trimTrailingWhitespace": true,

Next up, we will take a look at how to configure VSCode for debugging PowerShell scripts.

Posted in PowerShell, PowerShellEditorServices, VSCode | Tagged , , | 7 Comments

Debugging in the PowerShellEditorServices for Visual Studio Code

You’ve probably heard about Microsoft’s Visual Studio Code editor.  It was announced at the 2014 online Connect event.  It is a free, light-weight, cross-platform code editor supporting Windows, Linux and MacOS. 

I’ve been a big fan and user of the built-in PowerShell ISE for years.  It is still the best “debugger” out there.  However the ISE editor limitations, lack of customization, lack of source control integration and general atrophy (ISE hasn’t been significantly updated since it shipped with V2) was really starting to get to me.

As a user of Visual Studio, I really appreciate its extensibility support and more importantly the active ecosystem built around that extensibility.  I use VS extensions, often referred to as VSIXs, to improve the editor’s capabilities.  I use the Microsoft Productivity Power Tools, Web Essentials and C# Essentials.  A number of these tools, like the Productivity Power Tools, add editor enhancements that would work in any language.  If only PowerShell ISE had this sort of an extension ecosystem. 

Unfortunately, the reality is that a editor such as ISE, dedicated to a “single” language, is very unlikely to ever gain such momentum as VS has with its extensions.  And it doesn’t help that the ISE extension API is sorely lacking.  You do however see such extensibility and momentum around light-weight code editors such as Sublime and Atom. 

So I was really excited by the prospect of Visual Studio Code when it was announced.  I figured VSCode had the following advantages over PowerShell ISE:

  • VSCode is being actively developed and enhanced.
  • It is already a more powerful text editor with features like multicursor support.
  • Version control support via Git is built-in.
  • You can use it on Linux.  Yeah, I’m still hoping we will see PowerShell running on Linux at some point.

The downside to VSCode’s PowerShell support at that time were poor syntax highlighting and Intellisense but more importantly no debug suppport and no REPL.  I tried to help improve the syntax highlighting by sending some regex changes to the VSCode team.  That helped a little but unknownst to me at the time, the whole VSCode PowerShell support landscape was about to change.

At the 2015 online Connect event, Microsoft made two huge announcements about VSCode.  First, Microsoft open sourced VSCode on GitHub.  Second, Microsoft finally announced a supported extensibility API for VSCode.  As a PowerShell MVP, I was made aware of an effort to build a PowerShell Editor Services extension for VSCode.  I immediately signed up to help as the extension would be made open source on GitHub as well.

This extension addresses many issues with PowerShell support in VSCode.  First, it adopts a syntax colorization grammar format called TextMate that other light-weight editors use.  Second, it provides a mechanism to hook into the editor to provide all sorts of features such as Intellisense, Symbol searching & highlighting, alias expansion, etc.  Third, there is a debugging API to provide debug support for a language. 

David Wilson and others on the PowerShell team did a ton of work to get the very capable PowerShellEditorServices extension off the ground.  Since then, some MVPs including myself, Doug Finke and Adam Driscoll have been submitting PRs to improve the extension.

I have submitted a number of PRs in the last couple of months.  The first was to support Symbol search in PowerShell e.g. type Ctrl+P, then “@:” to see all the symbols in your open script files.  Note that as you move the selection amongst the different symbols in the list, the associated script is highlighted in the editor e.g.:

image

The rest of my PRs have been to enhance the debugger’s Variables display to provide more and better representations of PowerShell and .NET types.  For instance, PSCustomObjects now display their properties in the Variables window.  Collections display their contents and .NET objects wrapped in a PSObject are unwrapped to show the underlying object’s properties.  Here is what the Variables window looks like now when debugging a PowerShell script in VSCode:

image

The Variables window for this extension shows four top level containers.  The Script and Global containers are fairly obvious in terms of what they contain.  The Local container contains the local variables for the currently selected stack frame i.e. the selected line in the “Call Stack” section. 

The Auto container attempts to show you the variables you are likely to be interested in for any particular stack frame.  The idea is shamelessly borrowed from Visual Studio’s excellent debugger.  The heuristics for determining what gets displayed in the Auto window will likely change as we get more experience using this debugger.  If you have suggestions, please leave them at https://github.com/PowerShell/PowerShellEditorServices/issues.

As you explore the variables in any of the four containers, you will note that collections show not only their type but the number of elements in the collection.  For example, see the variable $Process in the image above under the Auto container.  It displays as $Process: [Process[1]] and when you open that node you see each element displayed (only one in this case).

Also note that the debugger in VSCode has sections (windows) to show breakpoints and variables you are “watching”.  There is even a “REPL” window that is active while debugging. 

I’m very excited by how much richer this extension makes both the PowerShell editing and debug experience in VSCode.  I’m currently in “dog-fooding” mode with VSCode as my primary editor for PowerShell.  I’m sure we will find many things that need to be improved as we use the extension and VSCode together.  But the really cool thing is that since the extension is open source, we don’t have to wait for someone on the PowerShell team to fix a bug or implement a new feature.  We can do that ourselves! 

I expect big uptake for PowerShellEditorServices extension for VSCode in 2016.  Heck, the extension was made public on the VSCode Marketplace only a little over a month ago and it’s already approaching 9000 downloads.  That’s pretty impressive!

I’ll sign off with one last tip.  If you are a Pluralsight subscriber, you should check out John Papa’s course on Visual Studio Code.  It is excellent!  If you are not a subscriber, you can sign up for a free trial and get 10 free days (or up to 200 minutes) to start watching this course.  BTW there are also some pretty awesome PowerShell courses on Pluralsight from notable PowerShell luminaires such as Don Jones, Jeff Hicks, Jim Christopher, Adam Bertram, Thomas Lee and many others.

Posted in PowerShell, PowerShellEditorServices, VSCode | Tagged , , | 1 Comment

PowerShell Snippets for Visual Studio Code

If you are a fan of using Visual Studio Code as a lightweight text editor and are also a PowerShell scripter, you have probably found VS Code’s PowerShell support somewhat lacking.  For instance, while it can syntax colorize PowerShell script such as showing $foo in the color for variables, it doesn’t know that ${global:foo} is also a variable.  I have submitted an issue on this along with an improved powershellDef.js file.  You should be able to pull that down from here.  Then copy that into your C:\Program Files (x86)\Microsoft VS Code\resources\app\plugins\vs.language.powershell\out directory.

Another issue is that there are no snippets for PowerShell.  Well, now there is.  Grab this powershell.json snippets file from here and put it in your ~\AppData\Roaming\Code\User\Snippets directory.  This snippets file provides the following snippets:

  • Class
  • Condition double quoted string statement
  • Condition expression statement
  • Condition single quoted string statement
  • Condition statement
  • Do…until loop
  • Do…while loop
  • Else statement
  • ElseIf statement
  • Enum
  • For loop
  • Foreach statement
  • Function
  • Function advanced
  • Help
  • If statement
  • Method
  • Property
  • Property hidden
  • Reverse for loop
  • Switch statement
  • Try catch
  • Try catch finally
  • Try finallly
  • While loop

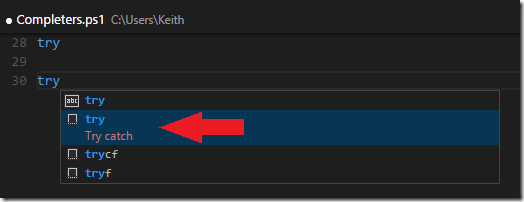
Once you installed the snippets file, you can create a PowerShell script file – save it as a .PS1 file and Code will recognize it as a PowerShell script.  If it is not saved, press Ctrl+Shift+P to bring up the command palette, select “Change Language Mode” then select PowerShell.  Now type “tr” and you should see a completion list like this appear:

image

Note that the first entry in the completion list above, with the icon “abc”, is there because the word “try” was used elsewhere in my script file.  This is very basic form of Intellisense providing auto-completion of words that it has encountered in the file. You will want to press the down arrow to select the other entries.  Notice that snippets have an icon that looks like an empty box with dotted lines on the bottom.  And snippets typically display a description as well e.g. “Try catch”.  Press either {Tab} or {Enter} to use the snippet.

Enjoy and let me know if you find any issues.  Note that snippets in Visual Studio Code act a bit weird when auto-completion takes place.  It will no longer allow you to tab through the various placeholders in a snippet.  I’ve submitted that as an issue to the VS Code team.  Hopefully they can fix it (or educate me on how it supposed to work).

Posted in PowerShell, VSCode | 13 Comments

An Explanation of the .NET add_EventName / remove_EventName Methods for PowerShell Scripters

If you have ever attempted to write a little WinForms or WPF UI using PowerShell you have no doubt run across a method like add_Click() e.g.

Add-Type -AssemblyName System.Windows.Forms 
$form = New-Object Windows.Forms.Form 
$button = New-Object Windows.Forms.Button 
$button.Text = "Close" 
$button.add_Click({$form.Close()}) 
$form.Controls.Add($button) 
$form.ShowDialog() 

This might be a bit confusing if you are looking at C# examples or even the MSDN topic on a Windows Form Button.  It says the event name is simply “Click”.  What is going on here?

When C# and .NET were first introduced they were inspired by Java but they also added some features Java didn’t have.  Two of these features were language level support for properties and events.  Two concepts borrowed from Delphi which isn’t too surprising given that the chief architect of C#, Anders Heljsberg, came from Borland where he was the chief architect of Delphi.  Anders’ contributions date back to the introduction of Turbo Pascal which I thoroughly enjoyed during my college days.

The basic gist of properties is that they are used as if you are reading and writing a field of an object except that the author of the type can inject code during the read/write process.  So in C#, when creating a class you can create a property like this:

public class MyClass 
{
    private string _name;
    public string Name 
    {
        get { return _name; }
        set
        {
            if (_name != value) 
            {
                _name = value;
            }
        }
    }
}

As an author of a type in .NET this is great because I can check to see if the value is different and only if it is different, perform some application specific logic.  For instance, WPF apps often need to let UI elements know when the value of the property has changed.  WPF’s data binding relies on this behavior and when it has been notified of a change to a property, it can get the new value for the property and update the UI automatically. Properties in .NET give us the necessary hooks to do this.

Note that in the code above, _name is a field. If I had made that field public, then a user of the type would have direct access to the field.  They could get or set the _name field and the class would have no way to know the field has been accessed or modified because there is no way to inject code during the read or write of a field.

Keep in mind that getting and setting a property in C#, VB and PowerShell is a language convenience commonly referred to as “syntactical sugar“.  When the C# source above is compiled, the generated assembly (dll or exe) shows this representation in common intermediate language (CIL):

image

Sidebar: Common Intermediate Language
What C# and VB compile down to is known as Common Intermediate Language.  This is typically what a .NET executable or DLL contains.  It is an architecture neutral representation of compiled source code that is not directly executable.  It has to be “just in time” compiled using a jitter (just-in-time compiler) or “ahead-of-time” compiled using a tool such as ngen.exe or the new .NET native compiler.

In either case, the JIT or AOT compiler needs to know the CPU architecture of the target device so it can generate the appropriate machine code.  This is typically either x86 (32 or 64 bit) or ARM.  .NET assemblies running on a Raspbery Pi2 with Windows 10 IoT or a Windows Phone require ARM compiled machine code

I’m using a tool called ILDASM that comes with the Windows SDK above to show the CIL contents of the .NET assembly generated from the C# MyClass source code shown above.  Notice that there is a “Name” property.  Here’s what ILDASM shows if you double-click on Name:

.property instance string Name()
{
  .get instance string MyClass::get_Name()
  .set instance void MyClass::set_Name(string)
} // end of property MyClass::Name

The Name property is simply a pointer to the compiler generated methods get_Name() and set_Name(string).  This is where the actual implementations of the property getter and setter reside.

The way you access a property in Java is to call a method; either a get<Property> or set<Property> method.  This is a common convention that is used because Java does not have first class support for properties.   Fortunately, accessing a property in C# looks just like you are reading or writing a field:

var obj = new MyClass();
obj.Name = "John";
Console.WriteLine(obj.Name);

Keep in mind that the C# source “obj.Name” is converted into a call to obj.get_Name() and obj.Name = “John” is converted to a call to obj.set_Name(“John”) at the CIL level.  At first glance this seems like it would be a minimal convenience but it turns out to be huge for C# and .NET’s usability IMO.

PowerShell also supports the property access syntactical sugar at the language level as well:

$obj = New-Object MyClass
$obj.Name = 'John'
$obj.Name

Unfortunately, PowerShell does not support .NET event subscription syntactical sugar like C# and VB do.  That said, you’ll see that there is an easy workaround.  You could also argue that for most scripting scenarios you don’t use .NET events.  However, as soon as you want to build a UI, either with Windows Forms or WPF you’ll be using events, perhaps a lot.

Lets take a look at a class definition with events:

using System;
using System.ComponentModel;

public class MyClass : INotifyPropertyChanged
{
    private string _name;
    public string Name 
    {
        get { return _name; }
        set
        {
            if (_name != value) 
            {
                _name = value;
                OnPropertyChanged(nameof(Name));   
            }
        }
    }

    public event PropertyChangedEventHandler PropertyChanged;

    private void OnPropertyChanged(string propertyName)
    {
        PropertyChanged?.Invoke(this, 
            new PropertyChangedEventArgs(propertyName));
    }        
}

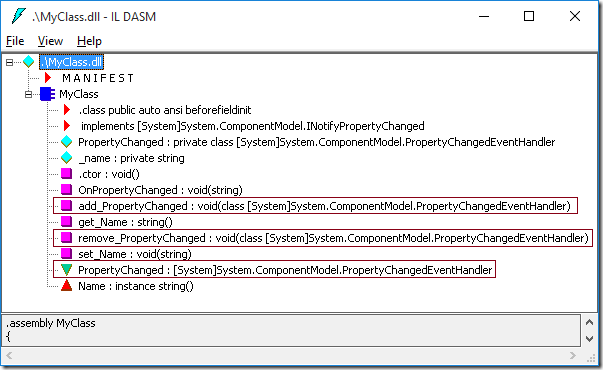
This adds an event definition – PropertyChanged.  Let’s take a look at the CIL that got generated when I compiled this C# source code:

image

Notice again that there is an event called “PropertyChanged” but if we look at its CIL definition we will see it is very similar to the one for the Name property:

.event [System]System.ComponentModel.PropertyChangedEventHandler PropertyChanged
{
  .addon instance void MyClass::add_PropertyChanged(class [System]System.ComponentModel.PropertyChangedEventHandler)
  .removeon instance void MyClass::remove_PropertyChanged(class [System]System.ComponentModel.PropertyChangedEventHandler)
} // end of event MyClass::PropertyChanged

It just references the add_PropertyChanged and remove_PropertyChanged methods.  The actual implementation of event subscription and unsubscription are done in these two methods.

In C# you can subscribe to the PropertyChanged event with the += and -= syntactical sugar e.g.:

var obj = new MyClass();
obj.PropertyChanged += 
    (sender, args) => Console.WriteLine(args.PropertyName);

The same syntax += in PowerShell does not work for event subscription.  Fortunately the syntactical sugar is not required, we can just call the add_PropertyChanged() method directly.  The same goes for remove_PropertyChanged(), instead of C#’s -= syntax, if we need to unsubscribe from the event.

Add-Type -Path .\MyClass.dll
$obj = New-Object MyClass
$obj.add_PropertyChanged({Write-Host "$($_.PropertyName)"})
$obj.Name = 'Paul'

It works. It perhaps isn’t as elegant but more importantly I think the issue is lack of documentation and examples that use an event’s add/remove methods.  This is because the vast majority of .NET samples on the internet are in C# which are going to use the += and -= syntax..  It leaves the average PowerShell scripter scratching their head about why the C# += syntax doesn’t work.  And wondering what is up with this weird add_Click() method in the PowerShell script examples that show how to use Windows Forms.

Hopefully, if you’ve made it this far, you’ll have a good handle on these compiler generated methods for subscribing and unsubscribing to events.

Posted in .NET, PowerShell | 4 Comments